How To Read the Racing Form
The key reason to read the racing form is to understand the details of the race and the history of the horses running in it so you can make an informed judgment about which horse or horses you think will perform the best.
Betting Strategies
There are generally three strategies for betting on horses, 1) putting your money on horses that win regardless of their running times; 2) putting your money on horses that run fast times regardless of where they finish and 3) putting your money on horses that have names you like.
Don't laugh at number 3. Anyone who's spent any time at the track will tell you stories of having a friend do much better than them that day when their only strategy was betting on horses by name. The only caution I'll give you about placing money on horses with popular names is that you're probably not the only one doing it so the potential payout will decrease. If the horse legitimately should be 8-1 but ends up going off at 4-1 because a bunch of people bet it simply for the name then you won't be getting as much value in return as you should for the risk you're assuming.
Racing Form - Race Info
Since strategy 3 doesn't involve any actual strategy, let's just consider the other two, betting on horses that perform well in finishing position and betting on horses that perform well on time. Take a look below at an actual piece from a racing form for a day at Keeneland race track last fall.
At the very top is the info on the race itself. This is the 2nd race of the day and the very top has the wagering information that will be allowed for this race. In addition to the Win, Place and Show bets you can bet the exacta (correctly predicting the first 2 horses in order), the trifecta (correctly predicting the first 3 horses in order), the superfecta (correctly predicting the first 4 horses in order) and the Pick 3 (correctly picking the winner in race 2-3-4) and Pick 4 (correctly picking the winner in race 2-3-4-5). See the wagering tutorial for an explanation on these types of bets.
You'll also see that this is a claiming race of a distance of 6 furlongs. A furlong is 1/8 of a mile, so a 6F race is 3/4 of a mile. You can see the graphic to the right of the distance information that shows you which part of the racetrack the race will be run on. As you can see from the graphic the race will begin on the backstretch on the outer dirt surface and make one turn onto the front stretch and end in the usual position on the track. You'll notice that the purse for this race is $20,000 and you'll even see the start time for the race, the first is for eastern, central, mountain and pacific with the local track start time in parenthesis.
Racing Form - Horse Info
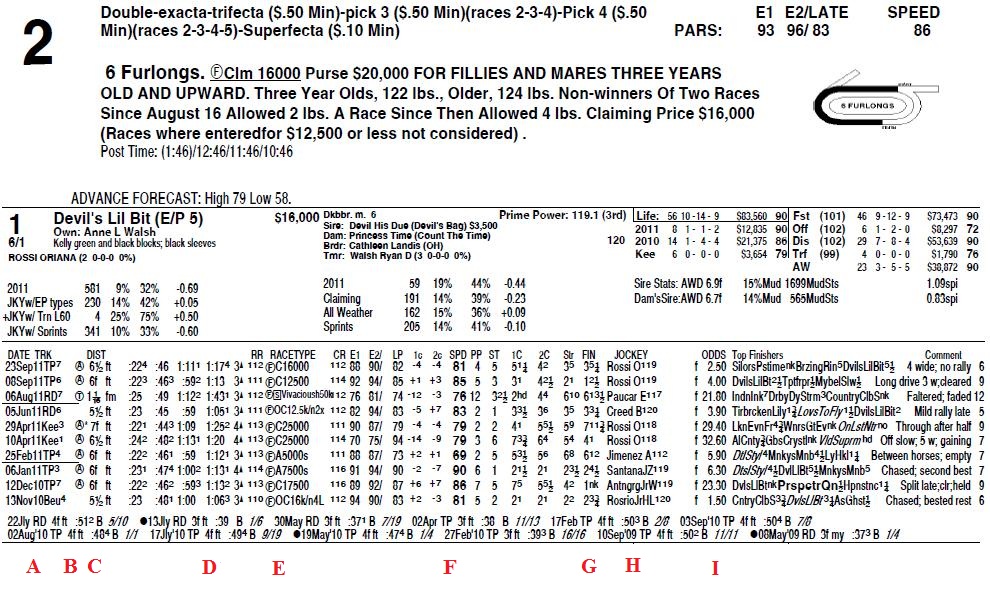
After the basic race information is listed you'll see information on each horse. In the example below I've only cropped the info on one horse, but in the program you'll see the info on every horse in the race. The upper part lists the basic information on the horse, the middle part lists its statistics from previously run races and then the last part along the very bottom is the info available on the horse's recent workouts (practice/training runs).
Let's start with the upper part that has the basic info on the horse. This horse is named Devil's Lil Bit, it is starting from the #1 position and its morning line odds are 6/1. The morning line odds are set by the track's professional handicapper and are a useful guide for how the professional handicapper expects the betting to go on these horses. Next to the horse's name is the running style figure on a scale from 0-8. A horse with an 8 is expected to push for the lead early and try to win from the front, a horse with a 0 is expected to be at the back early and win with a late rally. Underneath the horse's name is that of the owner, and then of the jockey, plus the jockey's stats. This particular jockey had 2 starts and no wins, places or shows. Moving to the right you can see the info on the horse's parents and breeder and trainer. Moving to the right again you can see the performance history for the horse. This horse has had 56 starts in its lifetime with 10 wins (1st place), 14 places (2nd place) and 9 shows (3rd place). You can see the same info for just 2011, just 2010 and just at that track (Keeneland). Even to the right of that are stats for the horse on various surfaces and for the current distance.
Racing Form - Past Performance Info
When you look at the race performance information there's a lot of data here, some more useful than others. If you've ever been around gamblers before you'll know that there are some gamblers that want to know every minute detail there is in the hope that they can find an edge, so there ends up being a lot of data listed. I'll walk you through what is useful and important to know, I've placed letters in red below the various columns I want to specifically explain to you.
(A) Date and Track - this just tells you when and where the race was run. For example the top (most recent) entry for this horse was on September 23, 2011 at Turfway Park
(B) Surface indicator - just to the left of the distance column you'll see in some cases a surface indicator. Where there is no entry it means the race was run on a typical dirt surface. If you see a 'T', as you do on the third race down, this means the race was run on turf (grass). The races where there is an 'A' means it was run on an all weather surface. Generally you'll see horses specialize in either dirt or turf (grass). The running times on turf (grass) are usually a little bit quicker than on the dirt. If you've ever run in soft sand on the beach you'll understand why the dirt times are a little slower than the grass times. It's important to keep this in mind if you're ever trying to compare the times of two horses or two races.
(C) Distance - the length of the race. Remember that a furlong is 1/8 of a mile. This horse has mostly raced 6F races (3/4 of a mile) with some others like a 7F and a mile and a mile and 1/16 in there as well.
(D) Final time of the winning horse - this column show the time of the horse that won the race. For example in the top entry the race was run in 1:17. It's important to remember though that this time is for the horse that won the race, not necessarily for the horse you're looking at. For example in the top race this horse finished 3rd and was beaten by 5.25 lengths. The custom is to add .2 seconds for each length (or more accurately .17 seconds, but .2 is easier to compute in your head) so this horse probably crossed the finish line a little over a second after the winning horse did. Also, the columns to the left of the finish time show the time of the leading horse at various points throughout the race.
(E) Type of race - you'll see that the last race this horse ran was a $16,000 claiming race, and before that it was a $12,500 claiming race. This is how you can tell when a horse is moving up or down in class. The assumption is that the larger the purse, the better the competition.
(F) The speed figure of the race for the horse - most of the companies that publish these racing forms have their own computer generated figure that they'll assign to the horse for the race. The speed figure takes into account how well the horse ran, how well the horse finished, how it ran at key times and how it measured up against other horses, and it attempts to normalize some variables like track condition so that you can compare apples to apples even when horses ran different distances against different competition on different tracks.
(G) Finish - this column tells you where they finished and by what distance. In the top race the horse finished 3rd, 5 & 1/4 lengths back. In the second race the horse finished 1st by 2 & 1/2 lengths. The time before that it finished 6th, 13 & 1/2 lengths back, and so on ...
(H) Jockey - this tells you the name of the jockey that was on the horse that day. Sometimes you'll see that a horse runs really well with a particular jockey and really bad with others. If the horse has the good jockey that day you may want to bet on him, if he has the jockey with the bad track record maybe you want to look elsewhere.
(I) Odds - these were the final odds on the horse at race time. In the most recent race this horse's odds were 2.5 (5/2) and that's what it would have paid if it had won. This gives you a good idea of what the betting public thought of the horse's chances at race time.
Key Takeaways
This is a lot of data to absorb so let me try and help you as a beginner to narrow it down. First pick a strategy, do you want to bet on horses that have a track record of winning or do you want to bet on horses that have shown they can get around the track in fast times?
If you want to bet on horses that have a winning track record look down column G for finish and find horses with a lot of wins. Then compare the wins with column E which shows the purse of the race. If you can't decide between two horses and one's won a lot of $25,000 races while the other's won a lot of $50,000 races bet on the one who's won against tougher competition.
If you want to bet on horses that have fast running times find some comparisons for common distances among the horses and then go horse to horse and compare the running times of each horse that's run the same distance. Remember that the final time shown on the form is for the first place horse and to adjust the time accordingly.
Have fun and good luck.